Every optimisation guide, including the rest of this category, stands or falls on one skill: measuring the same thing the same way twice. To benchmark your PC before and after emulator optimization tweaks is not about synthetic scores — it is about a fixed scene, a fixed method, and written numbers, so that a tweak’s effect (including the common result, “no effect”) is a fact rather than a vibe. This guide lays out a complete home protocol that takes twenty minutes to set up and five minutes per tweak thereafter: the scene rules, the metrics that matter (average FPS, 1% lows, frame-time graphs), the confounders that invalidate results, and how many runs a trustworthy conclusion needs.
Why “It Feels Faster” Fails
Human perception of frame rate is excellent at detecting change in the moment and terrible at remembering it across a reboot and three settings screens. Placebo is not a character flaw; it is the default. Worse, emulator performance naturally varies run to run by a few percent with scene population, shader cache state, background OS activity, and thermals — variation large enough to impersonate most tweaks’ real effects. Without a baseline protocol, you will keep useless changes, revert useful ones, and steadily accumulate a machine configured by superstition. The protocol below is the antidote, and it is deliberately boring.
Choose the Test Scene Like an Engineer
- Repeatable: a training mode, a saved position overlooking a busy area, a built-in benchmark, or a scripted route through a map. Races and matches against live opponents are unrepeatable — reject them.
- Demanding but not cinematic: the worst area you regularly play, not a cutscene (cutscenes often run at locked rates and render differently).
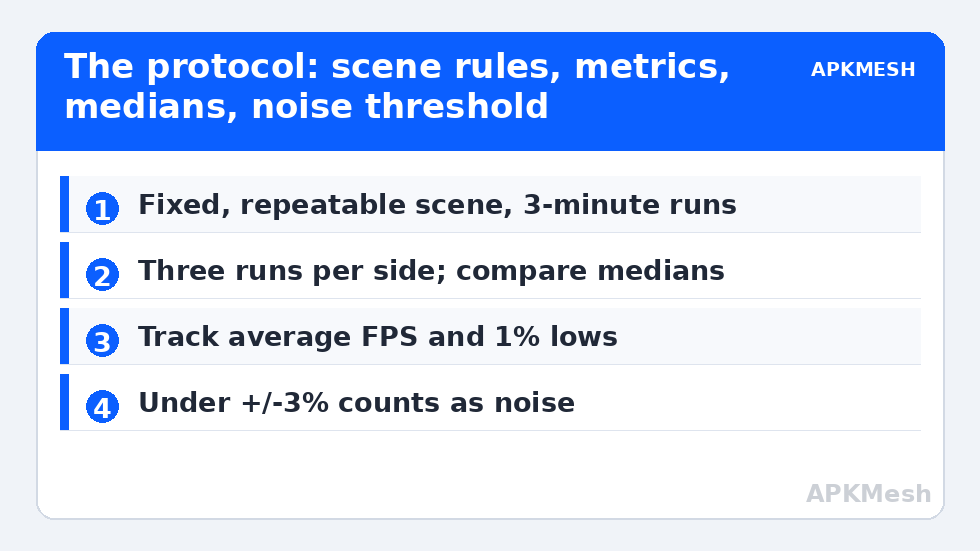
- Long enough: three minutes minimum per run; thermal behaviour and shader compilation both need time to declare themselves.
- Identical inputs: same emulator build, same instance, same settings, same Windows session state as far as practical, same charger/perf mode on laptops.
Write the scene definition down (“Game X, training ground, stand at spawn, camera sweep left-right for 3 minutes, 1080p render, Vulkan”) so precisely that you could reproduce it after a reinstall. That note is your laboratory notebook.
Lag risk: —
Capture the Metrics That Matter
- Average FPS — the headline number and the least informative alone.
- 1% and 0.1% lows — the frame rates of the worst moments; gameplay feel lives here. CapFrameX computes these from a capture; RTSS/Afterburner logs give approximations.
- Frame-time graph — a flat line with occasional spikes reads completely differently from a sawtooth of the same average; keep a screenshot of the graph per condition.
- Context telemetry: CPU/GPU temperature and clocks at run end, idle RAM before launch. A “tweak gain” recorded while the machine was cold is a thermal artefact, and the overlay method is how you log these.
Tooling: CapFrameX (free, purpose-built for exactly this comparison workflow), RTSS frametime overlay, or the emulator’s own FPS counter plus disciplined notes if you want zero installs. Any is fine; inconsistency of tool between before and after is not.
The Protocol
- Baseline: reboot, wait five minutes for Windows to settle, run the scene three times, record all three. Your baseline is the median run, not the best.
- Apply exactly one change (or one thematically inseparable group, labelled as such).
- Reboot if the change involves drivers, BIOS, services, or anything that plausibly has a first-run effect. Note shader-cache state: if the change could clear caches (driver work), discount or pre-warm the first run.
- Run the scene three times again; compare medians. A difference under ±3% is noise on most home setups — record the tweak as neutral, and keep-or-revert it on secondary grounds (security, convenience).
- Log everything in your notes file: date, change, medians, verdict. Revert immediately anything negative; do not stack maybes.
Confounders That Invalidate Home Benchmarks
| Confounder | How it fakes a result | Control |
|---|---|---|
| Shader cache state | First runs after driver/cache changes stutter, masquerading as regression (or the reverse) | Pre-warm or discard run 1; see the shader cache guide |
| Thermals/heat soak | Back-to-back runs get slower as the machine heats | Rest between runs; log end temperatures; compare like-with-like session positions |
| Windows background events | An update check or indexing pass lands in one run only | Three runs + median; idle five minutes before starting |
| Battery vs AC (laptops) | Entire performance tier changes | All runs on AC, same vendor perf mode |
| Scene drift | Time-of-day, weather, NPC density alter load | Fixed save/position; identical camera route |
This protocol is the operating system underneath every other guide in the PC Optimization hub — HAGS, power plans, priority, services all cite it because without it their honest answer (“it depends”) has no way to resolve on your machine. It also pairs with the long-game discipline of the maintenance checklist: baselines recorded when healthy become the evidence when something later degrades.
A Worked Example (So the Numbers Mean Something)
A budget laptop, LDPlayer, one fixed training-ground scene. Baseline medians from three runs: 57 FPS average, 41 FPS 1% low, CPU 96°C at end of run three, clocks visibly sagging by minute two of each run. The owner tests a popular registry “latency pack”: medians 58 / 42 — inside noise, correctly logged as neutral and reverted. Next, the GPU-assignment check discovers the emulator has been rendering on the integrated GPU all along; switching to the discrete card yields 74 / 58 — a step change no sane person attributes to noise. Finally, a fan-clean and rear elevation brings end-of-run temperature to 88°C and the 1% low climbs to 63 as the late-run clock sag disappears. Three conclusions, all earned: the registry pack was theatre, the GPU assignment was the machine’s main fault, and thermals were the second. Without medians and notes, the same owner would likely have credited the pack, never found the GPU issue, and thermal-throttled forever. That, in miniature, is why this guide exists and why it is filed first among equals in this category.
Keep the notebook permanently. Six months and two Windows feature updates later, when performance feels different and you cannot say why, the baseline pages let you re-run the identical scenes and localise the drift to a driver, a build, or a season’s worth of dust. Benchmarking is not a launch-day ceremony; it is the machine’s medical record.
One confounder deserves its own ritual: shader compilation. The first run in any new scene, after a driver update, or on a freshly created instance spends part of its budget compiling shaders, and frame times from that run describe the compiler, not the machine. Build a warm-up lap into every test — run the scene once, discard the data, restart it, and only then start recording. If a tweak seems to produce a miraculous improvement exactly one run after installation, suspect warm-up contamination before you celebrate, and re-run the baseline under the same conditions to check.
Frequently Asked Questions
How many runs do I really need?
Three per condition is the practical minimum for a median that resists outliers. If the three runs disagree wildly (spreads over ~8%), the scene or environment is unstable — fix repeatability (longer runs, better-defined scene, controlled background) before drawing any conclusion. One run per side is astrology.
Are synthetic benchmarks (Cinebench, 3DMark) useful here?
For component health and comparing hardware, yes. For judging an emulator tweak, no — they measure different bottlenecks. A Cinebench gain from XMP does not guarantee an emulator gain; your fixed emulator scene is the only court with jurisdiction. Use synthetics as supporting telemetry, not the verdict.
What is a good free tool for 1% lows?
CapFrameX captures frame times from RTSS/PresentMon and computes averages, percentiles, and comparison graphs in exactly the layout this protocol needs. PresentMon alone (Intel’s open-source tool) also works if you are comfortable with CSVs.
My tweak showed +2%. Keep or revert?
+2% is inside typical noise, so classify it as neutral. Then decide on other merits: keep a harmless, reversible setting if it might help elsewhere; revert anything that cost security, stability, money, or complexity for a neutral result. Neutral results are valuable findings — they close lines of inquiry.
Should I benchmark every emulator and game separately?
Ideally, the one or two titles you actually play, on the emulator build you use. Bottlenecks are workload-specific; a tweak that helps a Vulkan title may do nothing for an OpenGL one. Two scenes cover most players’ reality without turning the hobby into a lab job.