
An emulator that runs perfectly for ten minutes and then slides into stutter is rarely “unoptimised” — it is hot. CPUs and GPUs protect themselves by cutting clocks (thermal throttling), and laptops do it aggressively because their cooling is thin. Using MSI Afterburner to monitor temps while emulating turns that suspicion into data: you watch core temperature, clock speed, and usage on an overlay while the game runs, and the graph tells you whether you have a thermal problem, a CPU bottleneck, or a GPU wall. This guide covers installing Afterburner with its statistics server, configuring the overlay items that matter for emulator diagnosis, and reading the results honestly. Despite the name, Afterburner works on any GPU brand, not just MSI cards.
Install Afterburner and RTSS — From the Right Place
Download MSI Afterburner only from MSI’s official product page. It is a popular enough tool that fake download sites bundle it with junk. The installer includes RivaTuner Statistics Server (RTSS) — accept it; RTSS is what draws the on-screen display and provides the frame-time graph. After installing, reboot if prompted, then open Afterburner and confirm it detects your GPU (name shown at the top). You do not need to overclock anything for monitoring; we will not touch the voltage or clock sliders in this guide at all. Overclocking a thermally limited laptop is how you make throttling arrive sooner, not later.
Configure the Overlay for Emulator Diagnosis
- Afterburner → Settings (gear) → Monitoring tab.
- For each item below, select it and tick Show in On-Screen Display: GPU temperature, GPU usage, GPU core clock, VRAM usage, CPU temperature, CPU usage (total, plus per-core if your CPU has 4–8 cores), CPU clock, RAM usage, and framerate + frametime (graph).
- Under On-Screen Display tab in RTSS, set a toggle hotkey and position. The frametime graph is the single most diagnostic item on this list — enable it.
- In RTSS’s main window you can also set a framerate limit; leave it unlimited during diagnosis (a cap hides the behaviour you are trying to see).
Lag risk: —
The Test Run and How to Read It
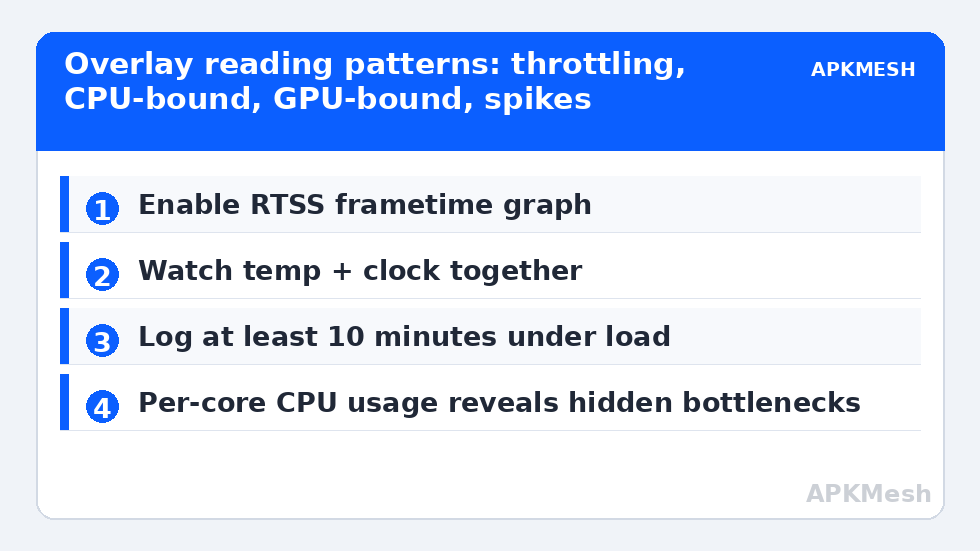
Start the emulator, load the game area that stutters, and play for at least ten minutes while watching the overlay. Cold-start numbers are meaningless; thermals are about heat soak. Interpret the patterns:
| What the overlay shows | What it means | Next step |
|---|---|---|
| CPU or GPU temp climbs to 95–100°C, then clock speed steps down and FPS falls with it | Classic thermal throttling | Cooling work: clean vents/fans, repaste on old machines, raise the laptop, lower ambient — see the thermal throttling guide |
| CPU usage pinned at ~100%, GPU usage well below 80%, temps modest | CPU bottleneck — the emulator cannot feed the GPU | Allocation, background load, and emulator settings; cooling will not help |
| GPU usage at 99%, temp high but clocks stable | GPU-bound; the card is the limit | Lower emulator resolution/render scale; this is a settings problem, not a fault |
| FPS stable but frametime graph shows regular spikes | Frame pacing issue: shader compilation, storage stalls, or a background process waking up | Check storage and background tasks; see the benchmarking guide for spike-hunting method |
| RAM usage at the ceiling with disk activity spikes | Paging — Windows is swapping to disk | Pagefile and RAM allocation work |
Logging: For Intermittent Problems
If stutter strikes unpredictably, enable logging instead of watching: in the Monitoring tab, set a log history path and hotkeys to start/stop logging, then play normally. The resulting log graphs temperature and clocks against time, letting you correlate “it stuttered at 21:40” with “the CPU hit its thermal limit at 21:39.” This is also the only honest way to evaluate a fix — repaste, new fan curve, cleaned vents — because you can compare clock-under-load before and after rather than relying on feel. Keep the same test scene for comparability, a principle the whole PC Optimization category leans on.
Safe Extras (and One Warning)
Afterburner’s fan tab lets you define a custom fan curve on many laptops and all desktop cards — a slightly more aggressive curve (fan reaching 100% a few degrees earlier) is a safe, reversible way to delay throttling, at the cost of noise. What not to do: the core voltage and power limit sliders. Raising power limits on a laptop can exceed its adapter and VRM design, and undervolting — legitimately useful on some CPUs — is done with other tools and its own testing discipline, not as a side-quest of a monitoring guide. Monitor first; modify knowingly, one variable at a time.
Numbers People Misread on the Overlay
Three readings generate most of the confused forum posts. First, CPU usage percentage is an average across cores: an emulator whose render thread maxes two cores of eight shows “25% CPU” while being completely CPU-bound. Enable per-core usage in the Monitoring tab if your diagnosis keeps concluding the CPU is idle while FPS is capped — the truth is usually one or two threads at 100%. Second, VRAM usage on shared-memory iGPUs reports system RAM carved out for graphics; a “VRAM full” reading on an integrated GPU is really a RAM pressure reading. Third, temperature is a lagging indicator: by the time you glance at 98°C the clock reduction already happened seconds earlier. Watch the core clock trace alongside the temperature — the clock line stepping down in a staircase while temperature stays pinned is the throttling signature, and it is the pair together, not either alone, that convicts cooling.
Finally, log a baseline when the machine is healthy, even if nothing is wrong today. A saved log of normal temperatures and clocks under your usual emulator scene becomes the reference every future “it feels slower lately” investigation compares against, turning guesswork into arithmetic. Baseline logging takes ten minutes once and is the cheapest diagnostic asset you own.
One last habit separates diagnosis from superstition: write the numbers down in a notes file with the date, emulator build, game, and scene. Temperatures drift with seasons and dust; a log that says “July, cleaned vents, GPU holds 1570 MHz at 84°C” lets next summer’s investigation start at step three instead of step zero, and it costs nothing but a minute per session.
Frequently Asked Questions
Does MSI Afterburner work with AMD and Intel GPUs?
Yes. Despite the MSI branding, Afterburner + RTSS monitor NVIDIA, AMD, and Intel graphics (including integrated GPUs for usage and temperature where the driver exposes sensors). The overlay and logging features are brand-agnostic; only some overclocking ranges differ.
What temperatures are normal for a laptop under emulator load?
Sustained CPU temperatures of 80–90°C and GPU 75–87°C are typical for gaming laptops working hard. The red flag is not the number alone but behaviour: clocks dropping hundreds of MHz while temperature sits at the chip’s limit (often 95–100°C CPU, ~87°C GPU) is throttling. A machine that holds its boost clocks at 88°C is fine; one at 100°C with falling clocks is not.
The overlay does not appear in my emulator. Why?
RTSS hooks the render API; emulator renderers using Vulkan or certain DirectX modes occasionally need RTSS’s injection delay adjusted, and some anti-cheat-protected games block overlays entirely. Try: set RTSS detection level to High for the emulator process, add the emulator executable as an RTSS profile, and make sure the emulator is not running as administrator while RTSS is not (mismatched privilege blocks injection).
Can Afterburner itself reduce performance?
The monitoring overhead is tiny (fractions of a percent) and the overlay is comparable. The polling rate for sensors can be raised from the default if you find the settings page sluggish, but for diagnosis the defaults are correct. If every FPS counts on a very weak iGPU, do your diagnosis runs, then close it for normal play.
What is a good free alternative for logging?
HWiNFO64 logs every sensor a machine exposes and pairs with the same RTSS overlay; CapFrameX is excellent for frame-time capture and comparison. Afterburner remains the simplest single install that covers overlay, graph, and log for this purpose.