
Your emulator is sitting at the desktop doing nothing — no game open, just the Android home screen — yet Task Manager shows it eating 60% CPU and 6 GB of RAM, the fans are loud, and everything else on the PC crawls. Learning how to fix high CPU and memory usage in Android emulators is mostly about separating the emulator’s reserved resources from what it’s actually burning, then finding the one process — inside Android or on the Windows side — that never idles. This guide works from measurement to fixes, because tuning blind just moves the problem around.
Step 1: Measure Properly Before Changing Anything
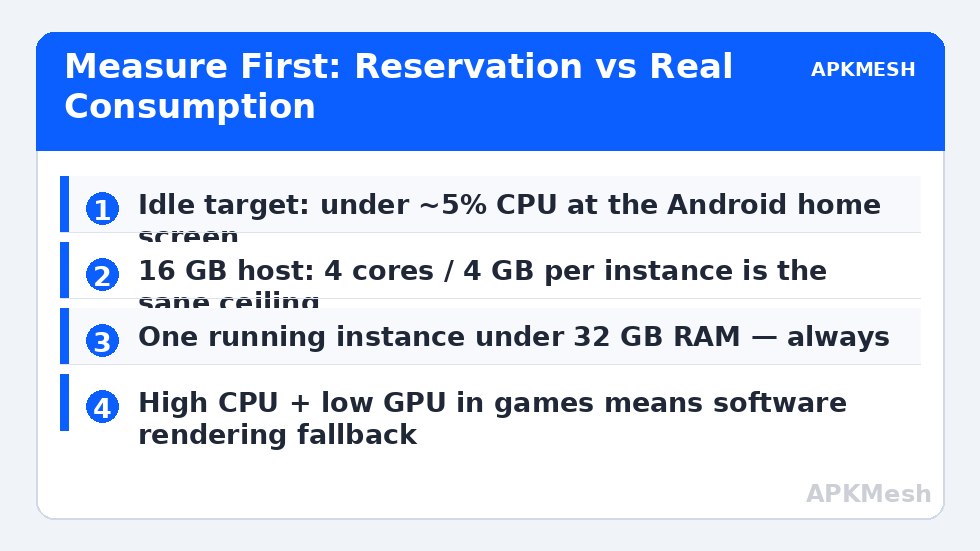
Open Task Manager → Processes and sort by CPU, then by Memory, with the emulator idle at its home screen for two minutes. Note three numbers:
- The emulator process CPU at idle (healthy: roughly 0–5% after settling; a brief spike right after boot is normal).
- The emulator’s memory compared to what you allocated it (an emulator given 4 GB will legitimately hold close to that — reservation is not waste).
- Whether some other process is the real consumer — antivirus scans, Windows Update, and browser tabs regularly impersonate “emulator lag.”
Also open the emulator’s own settings and write down your current CPU cores and RAM allocation. Half the cases in this category are a configuration problem visible right there.
Cause 1: Allocation Set to Maximum “Because More Is Better”
Allocating all your CPU cores and half your RAM does not make the emulator faster; it starves Windows, which then swaps and schedules badly, which the emulator experiences as stutter while Task Manager blames the emulator. Use these ceilings:
| Host system | Emulator CPU | Emulator RAM |
|---|---|---|
| 4 cores / 8 GB | 2 cores | 2–3 GB |
| 6 cores / 16 GB | 4 cores | 4 GB |
| 8 cores / 16 GB | 4 cores | 4–6 GB |
| 8+ cores / 32 GB | 4–6 cores | 6–8 GB |
One running instance, not three, on anything under 32 GB. Multi-instance is the single fastest way to make a healthy PC feel broken. If you are unsure what your machine should give, run the estimator rather than copying someone else’s settings from a forum:
Lag risk: —
Cause 2: A Runaway App or Service Inside Android
Sometimes the emulator is fine and an Android-side app is looping: a game stuck retrying a failed login, Play services syncing against a broken account state, or a poorly built app with a wake-lock habit. Diagnose by elimination:
- Force-stop your most recently installed apps (Android Settings → Apps) and watch idle CPU for a minute.
- If usage collapses, reintroduce apps one at a time.
- Check Play services health — if sign-in is erroring, repair the account layer with the Google sign-in guide; a services retry loop looks exactly like “emulator using CPU for no reason.”
- Boot a fresh instance with nothing installed. If it idles clean, your main instance’s app set — not the emulator — is the problem.
Cause 3: Software Rendering Fallback
When GPU acceleration fails silently — wrong renderer for your card, broken driver, or the emulator running on the wrong GPU in a hybrid laptop — the CPU ends up drawing every frame in software, and CPU usage pins at maximum in games while the GPU idles. Clues: high CPU + low GPU utilisation in Task Manager’s Performance tab during play. Fixes: switch renderer (Vulkan/DirectX/OpenGL) in emulator graphics settings, confirm Windows Graphics settings assign the emulator to the discrete GPU on laptops, and install the GPU vendor’s current driver. Display-pipeline faults like this also produce the black screen at startup in their more severe form.
Cause 4: Memory That Grows Until Everything Dies (Leaks and Bloat)
RAM that climbs steadily over hours — in the emulator process or a specific instance — points at a leak (in the emulator build or an app) or at instance bloat: months of cached data, downloaded game assets, and media. Countermeasures, in order:
- Restart the emulator daily rather than leaving instances running for weeks; this is normal hygiene for VM-based software, not a workaround.
- Inside Android, review Settings → Storage and clear genuinely dead weight (the storage-full guide shows where emulator storage actually goes).
- Update the emulator — leak fixes are a recurring theme in emulator changelogs, and staying on a year-old build means living with year-old leaks.
- Cap background instances: close instances you are not actively playing on instead of minimising them.
Cause 5: Windows-Side Pressure — Pagefile and Background Load
If total system memory sits above 90%, Windows compresses memory and pages aggressively, and every app pays. Keep the machine’s total commitment sane: close heavy background apps while emulating, let Windows manage the pagefile (manually tiny pagefiles cause out-of-memory crashes that look like emulator faults), and confirm the drive hosting the pagefile and emulator data is not nearly full. On 8 GB systems this cause and Cause 1 are usually the same problem seen from two sides.
How to Verify the Fix
Repeat the Step 1 measurement after each single change: two minutes idle at the Android home screen, then ten minutes in your most demanding game. Targets: idle CPU settles under ~5%, in-game CPU is high but the system total is not pinned at 100% with the disk light solid, and memory stays flat across a long session instead of climbing to a crash. If idle is clean but combat still chokes, your remaining problem is frame throughput, not usage — continue with the FPS drops during combat guide.
When This Will Not Work
Hardware has floors: a 4 GB RAM host cannot comfortably run Windows 11 plus a 64-bit Android instance plus a modern game, whatever the settings — the honest fix there is a lighter emulator build and 720p, or more RAM. A CPU without working virtualization falls back to brutally slow emulation paths; that shows up as permanent high CPU and is covered under VT troubleshooting. And if usage is extreme in every application, suspect the PC itself (failing drive, malware, broken Windows) rather than the emulator. The rest of this error-fix library covers the individual faults.
One More Suspect: The Emulator’s Own Extra Features
Modern emulators bundle side features that quietly consume resources: built-in recording/streaming helpers, app recommendation services, sync agents, macro daemons, and “smart” keymapping services that poll hardware continuously. In the emulator’s settings, disable the ones you do not use — particularly anything set to start automatically, record in the background, or sync across instances. The savings are individually small (a few percent each) but they stack, and on a marginal machine they are the difference between headroom and swapping. Reboot the emulator after trimming and repeat the idle measurement; if idle CPU dropped but in-game stutter persists unchanged, the remaining problem is frame throughput, which the combat-stutter guide linked earlier addresses directly.
Frequently Asked Questions
Is it normal for the emulator to use the full RAM I allocated?
Yes. Allocating 4 GB means the emulator reserves up to 4 GB for the Android system and its apps. That is reservation working as intended. The problems are CPU that never idles, memory that climbs without limit, or allocations so large the host starves.
Why does CPU spike to 100% for a minute after launching?
Boot involves decompressing images, starting dozens of Android services, and compiling app code. A launch spike that settles within a minute or two is normal. A spike that never settles is the fault this guide diagnoses.
Should I set the emulator process to High priority in Task Manager?
No, as a rule. High priority can starve Windows services and audio/input threads, making overall smoothness worse. Balanced allocations beat priority hacks on any healthy system.
My emulator uses lots of RAM but little CPU, and games still stutter. Why?
Then memory is not your bottleneck — look at renderer choice, resolution, and thermals. Usage numbers tell you where the pressure is; stutter with low CPU usually lives in the GPU/display path or frame pacing.
Does closing other instances really matter that much?
Yes. Each Android instance is a full virtual machine with its own RAM reservation and background services. Two idle instances can consume more than one instance actively gaming.